


In the figure above the La Nina is the cool body of water between Papua New Guinea and South America.
The Pacific Decadal Oscillation (shown here in cool mode) is the body of water of the U.S. west coast stretching from Alaska to the Equator. There appears to be a close correlation between the PDO and either the globe heating up or cooling down.
The Pacific Decadal Oscillation (shown here in cool mode) is the body of water of the U.S. west coast stretching from Alaska to the Equator. There appears to be a close correlation between the PDO and either the globe heating up or cooling down.

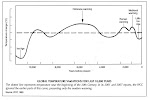
The figure above shows the cycles of the PDO from 1900 and speculates them out to 2035.
Interestingly here is a list of the fluctuations in the PDO and global climate (20th century): 1900-20: Cold; 1920-45:Warm ; 1945-77: Cold ; 1977-98: Warm ; 1998-Present: Cold .
Interestingly here is a list of the fluctuations in the PDO and global climate (20th century): 1900-20: Cold; 1920-45:Warm ; 1945-77: Cold ; 1977-98: Warm ; 1998-Present: Cold .
Dr. Don Easterbrook (PhD, Emeritus Professor of Geology, Western Washington University) and Dr. Roy Spencer (PhD, Climatologist, Principle Research Scientist, Earth System Science Center, The University of Alabama, Huntsville) are studying the Pacific Decadal Oscillation, a naturally occurring temperature fluctuation in the Pacific Ocean that has been observed by NASA (Aqua Satellite) satellite observations.
The PDO changes between warm and cold cycles approximately every 20 to 30 years, which changes the cloudiness of Earth, the behaviour of the jet stream and subsequently the temperature, according to NASA.
In the abstract for his article "Tropical Pacific decadal Variability and global warming," Benjamin Giese, a professor of oceanography at Texas A&M University, writes: "The results suggest that much of the decade to decade variations in global air temperature may be attributed to tropical Pacific decadal variability."
Spencer believes the PDO cycles explain about 75 percent of the climate change during the 20th century. During that time, Earth went through a cold period from 1900-20, was warm from 1920-45, cooled down from 1945-77 and warmed from 1977 - 98. Spencer and Easterbrook say all of those fluctuations correlate with changes in the PDO.


This can be seen when comparing these two graphs. With a warm phase of the PDO from 1915 to about 1945 and on the bottom NOAA graph the temperature rising from 1895 but with a notable rise from 1915 to about 1940. The PDO going into its cool phase from 1945 to about 1976 in the top graph and in the bottom one temps falling between 1940 and about 1976-77. The PDO going into it's warm phase again from 1976-77 till about 1998-99 and on the bottom graph showing a rising temperature through to it's end point at 1995.
In another article by Dr. Easterbrook called Shifting of the Pacific Decadal Oscillation from its warm mode to cool mode assures global cooling for the next three decades,(2008) he writes:
The announcement by NASA that the (PDO) had shifted from its warm mode to its cool mode is right on schedule as predicted by past climate and PDO changes (Easterbrook, 2001, 2006, 2007) and is not an oddity superimposed upon and masking the predicted severe warming by the IPCC. This has significant implications for the future and indicates that the IPCC climate
models were wrong in their prediction of global temperatures soaring 1°F per decade for the rest of the century.
..Instead of a rise of 1°F during the first decade of this century as predicted by IPCC climate models, global temperatures cooled slightly for the past nine years and cooled more than 1°F
this year. Global cooling over the past decade appears to be due to a global cooling trend set up by the PDO cool mode and a similar shift in the Atlantic. The IPCC’s prediction of a 1° F warming by 2011, will require warming of about 1° F in the next three years and unless that happens, the IPCC models will be proven invalid.
As shown by the historic pattern of PDOs over the past century (Fig. top above) and by corresponding global warming and cooling, the pattern is part of ongoing warm/cool cycles that last 25-30 years. Each time the PDO mode has shifted from warm to cool or cool to warm, the global climate has changed accordingly.
In 1977, the PDO shifted from cool mode to warm mode (Fig. top above) and set off the global warming from 1977 to 1998, often referred to as the “Great Climate Shift.” The recent shift from PDO warm mode to cool mode is similar to the shift that occurred in the mid-1940’s and resulted in 30 years of global cooling (Fig. top above). The global warming from 1915 to 1945
was also brought on by a mode shift in the PDO (Fig. top above). Every indication points continuation of the PDO patterns of the past century and global cooling for the next 30 years (Fig. top above). Thus, the global warming the Earth has experienced since 1977 appears to be over!

The figure above also shows the relationship between the PDO and the ENSO. During the PDO's warm phases such as 1977 to 1998 there were predominantly El Nino's with two very large ones in 1983 and 1998. However, during the PDO's cool cycle there are predominantly La Nina's. El Nino's still occur but are generally much weaker and shorter lived. In July 2009 we again moved from La Nina into El Nino and Joe D'Aleo of ICECAP wrote an article called: El Nino Now Official - Possible Implications. In it he says:
El Ninos in negative PDO eras tend to be shorter, weaker and colder (USHCN GISS version -0.12F) compared to El Ninos in a positive PDO era (+1.08F). Some of that is the data contamination (siting) issue which is greater in the recent +PDO era 1979-1998 than in the prior cold PDO 1950-1978. The ENSO models see this as a stronger event but with some hints it may peak before winter.
Another excellent article by Bob Tisdale entitled: Misunderstandings about the Pacific Decadal Oscillation is definitely worth a view to gain a deeper understanding of both the PDO, the ENSO and their relationship.
No comments:
Post a Comment