


June 25th, 2011
NOTE: I am making available the Excel spreadsheet with the simple forcing-feedback-diffusion model so people can experiment with it. The spreadsheet is fairly self-explanatory. THE DIFFUSION COEFFICIENTS CANNOT BE VARIED TOO DRASTICALLY SINCE, WITH A MONTHLY TIME STEP, THE MODEL WILL CREATE UNSTABLE TEMPERATURE OSCILLATIONS. This is a common problem with numerical integration, which could be eliminated by reducing the time step, but I wanted to keep the model file size manageable:
simple-forcing-feedback-ocean-heat-diffusion-model-v1.0
FOLLOWUP NOTE: The above spreadsheet has an error in the equations, which does not change the conclusions, but affects the physical consistency of the calculations. The heat capacity used for water is 10 times too low, and the diffusion coefficients are also 10x too low. Those errors cancel out. I will post a new spreadsheet when I get back to the office, as I am on travel now.

NASA’s James Hansen is probably right about this point: the importance of ocean heat storage to a better understanding of how sensitive the climate system is to our greenhouse gas emissions. The more efficient the oceans are at storing excess heat during warming, the slower will be the surface temperature response of the climate system to an imposed energy imbalance.
Unfortunately, the uncertainties over the rate at which vertical mixing takes place in the ocean allows climate modelers to dismiss a lack of recent warming by simply asserting that the deep oceans must somehow be absorbing the extra heat. Think Trenberth’s “missing heat“. (For a discussion of the complex processes involved in ocean mixing see here.)
Well, maybe what is really missing is the IPCC’s willingness to admit the climate system is simply not as sensitive to our greenhouse gas emissions as they claim it is. Maybe the missing heat is missing because it does not really exist.
This is where we can learn from the 40+ year record of deep ocean temperature changes. Even the 2007 IPCC report admitted the oceans have warmed more slowly at depth than the climate models can explain.
Here I will show quantitatively with a simple forcing-feedback-diffusion model that recent ocean warming is actually consistent with a climate sensitivity which is so low that the IPCC considers it very unlikely.
I will also show how disingenuous the IPCC 2007 report was in presenting the ocean warming evidence to support its view that anthropogenic global warming will be a serious problem.
The Need for Ocean Layers in a Climate Model
Ten years ago Dick Lindzen used a simple climate model to look into the issue of whether the rate of ocean warming at 500 meters depth might help us better understand how sensitive the climate system is. He concluded that it is the surface temperature that is most important, not what happens deeper down in the ocean.
Conceptually, the line of reasoning here would be that the deep ocean can’t warm unless the surface warms first, and the rate of surface warming is largely controlled by atmospheric feedbacks.
In contrast, Roger Pielke, Sr. has always maintained that the heat content of the ocean is what we should be monitoring, not the surface temperature, to better understand how sensitive the climate system is to various forcings.
I WILL say I firmly believe that the surface temperature is THE MOST important temperature in the climate system. This is because (1) the surface is where most sunlight is absorbed, (2) the atmosphere is then convectively coupled to the surface, and (3) the surface and atmosphere together are the ONLY way for the Earth to radiatively cool to space in the face of continuous solar heating.
But, as we will see, the detailed profile of recent warming with depth in the ocean does appear to have additional information about climate sensitivity that is not apparent from surface warming alone.
Explaining the Observed Heating Profile of the Ocean
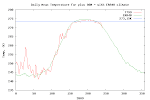
The following picture is worth a thousand words….but I will try to use fewer than that. First, it is partly a reworking of Fig. 9.15 of the IPCC 2007 report, showing the substantial discrepancy between observed global-average warming of the oceans to 700 meters depth (red curve), and warming estimated from the PCM1 climate model (solid green curve) for the 40-year period ending (I believe) around 2005 (click for the large version).

The green dashed line is my simple model simulation of the PCM1 model’s 40-year warming profile, where I used the GISS yearly global climate forcings to force temperature changes in the 30-layer model, where all layers have adjustable diffusion coefficients.
To get this match to the PCM1 model results, I specified the known PCM1 model net feedback parameter (1.8 Watts per sq. meter per degree), and then adjusted the diffusion coefficients between the simple model’s 50-meter thick layers extending from the surface to a depth of 1,500 meters until I got good agreement between my simple model and the PCM1 model results.
As you can see, my model fit (green dashed line) to the PCM1 model results (green solid line) is pretty good. (Some small amount of warming occurs all the way to the 1,500 m bottom of the model, although it is extremely weak). This demonstrates that the simple model can basically replicate the behavior of the much more complex PCM1 model, albeit for only global-average results.
Next, after I got the simple model to mimic the PCM1 model, then I tried to explain the observations (red) curve by adjusting (1) the model sensitivity (assumed feedback parameter), and (2) the diffusion coefficients, until the model explained the actual observed warming profile. Interestingly, the diffusion coefficients only needed to be changed for the top three ocean layers (down to 200 m depth, which would be about the bottom of the themocline.) The rest of the diffusion coefficients remained the same as in the PCM1-matching simulation.
The result is the blue curve. Significantly, the simple model required a feedback parameter equivalent to a climate sensitivity of only 1.3 deg. C in response to a doubling of CO2. This is well below the range of warming the IPCC claims is most likely (2.5 to 4 deg. C).
What It Means
The bottom line is that 40 years of warming of the 0-700 meter ocean layer has been so modest that, even if we assume it was caused by the GISS forcings (which Hansen believes will eventually cause strong warming) , it corresponds to low climate sensitivity anyway.
In other words, the oceans have not warmed enough to support the IPCC’s predictions of future warming.
The problem in the IPCC models seems to be that they mix excess heat too rapidly from the mixed layer into the deep ocean. This allows the models to retain high climate sensitivity, while limiting the amount of surface warming they produce to match the observed warming to date.
Voila! The models can thus “explain” the surface temperature record AND STILL predict strong warming for the future.
Even though the model I use is admittedly simple, this does not really matter because, in the global average, long-term temperature change is only a function of 3 basic processes:
(1) the strength of the forcing (imposed energy imbalance on the climate system, due to whatever);
(2) the strength of the climate system’s resistance to that forcing (net feedback, which determines climate sensitivity); and,
(3) the rate of ocean mixing (which affects surface temperature, which affects the rate of energy loss to space through feedback processes).
Everything else is details.
How the IPCC Cheated
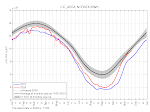
In the process of this little study I learned that the IPCC’s 2007 presentation of the ocean warming data was, at best, disingenuous. Here’s the original PCM1 panel of Fig. 9.15 from the 2007 IPCC report, from which I took numbers to re-plot on the figure, above:

With this figure, the IPCC was cleverly able to make it LOOK like there was general agreement between their climate models (green shaded area) and observations (red curve), with no less than four ploys:
1) They chose a climate model (PCM1) that is the 2nd LEAST sensitive of the twenty-something climate models they survey. PCM1 produces even less warming than the IPCC’s official projected range of warming from a doubling of CO2.
2) For the PCM1 model results, they presented a rather broad range of warming (green shaded area), meant to represent natural climate variations about the average warming produced by the model. In this way, they were able to get the weak observed warming to better overlap with the model produced warming, suggesting agreement.
3) They omitted the 0 deg. (no temperature change) vertical line from the figure, the presence of which would have visually revealed the significant discrepancy between the PCM1 model results and the observations.
4) They made the ocean depth scale nonlinear, which disproportionally emphasized the agreement in the relatively shallow mixed layer of the ocean, while downplaying the rather large discrepancy deeper down. But there is NO physical reason to make the ocean depth scale nonlinear; the total heat carrying capacity of the ocean varies linearly with depth, not non-linearly.
Conclusion
It appears that the vertical profile of ocean warming could be a key ingredient in getting a better idea of how sensitive the climate system is to our greenhouse gas emissions. The results here suggests the warming has been considerably weaker than what would be expected for a sensitive climate system.
The sensitivity number I estimate — 1.3 deg. C — arguably puts future warming in the realm of “eh, who cares?”
It will be interesting to see how the next IPCC report, now in the early stages of preparation, explains away the increasing discrepancies between their climate models and the observations. Since IPCC outcomes are ultimately driven by desired governmental policies and politicians, rather than science, I’m sure the wordsmithing (and figuresmithing) will be artfully done.
IMPORTANT NOTE: The above model simulation does not account for the possibility that some of recent warming could have been due to one or more natural processes, in which case the diagnosed climate sensitivity would be even lower.